在数学建模中,常常会有一些地理位置数据。为了快速地展现其位置分布,可以用百度地图api快速实现地理位置可视化。
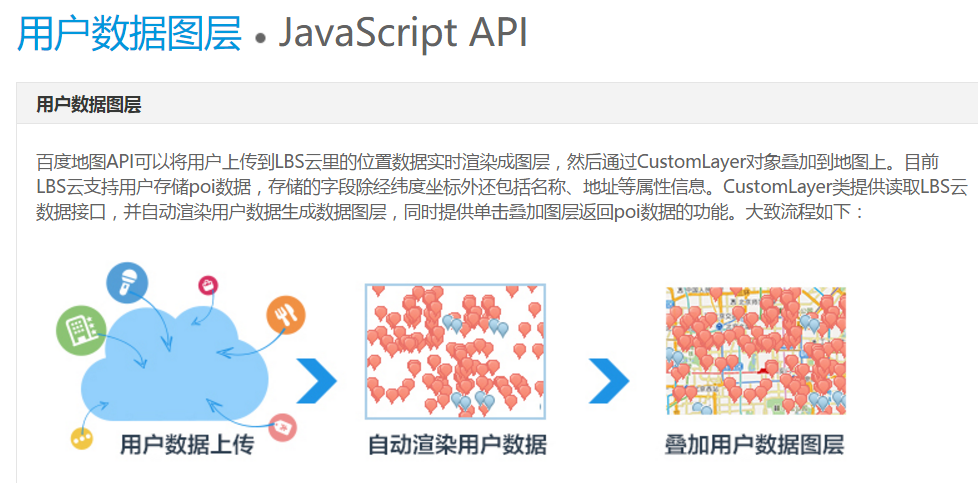
Table of Contents
0.概述
在会遇到一些与地理位置相关的建模问题时,难免会遇到需要可视化展示地理位置信息的需求。
可能许多人的第一反应是:
WTF我没做过前端,也不会js,这个东西怎么办
事实上,队伍内展示,或者只是作为团队内构建道路信息的工具,就可以用在线地图api实现可视化。(开发产品当然另当别论)
本篇学习笔记以百度地图api为例。只要稍微上过大学课程的c++之类的,看得懂一点点代码,就可以按照百度地图api手册给出的demo加以发挥。
1.开发者账户相关
用百度id注册百度地图开放平台,验证手机号和邮箱地址,会获得免费的配额。新建应用,获得秘钥。
包含以下内容及相应配额(懒..直接粘贴的表格)
| 服务名称 | 配额消费 | 配额上限 | 操作 | |
|---|---|---|---|---|
| 云存储API(存储) |
存储空间: 0% |
总存储空间: 10240MB
|
查看文档 数据管理 配额申请 | |
| 云存储API |
请求数: 0% |
总请求数: 10万次/天
|
查看文档 数据管理 流量图 配额申请 | |
| 云检索API |
请求数: 0% |
总请求数: 10万次/天
|
查看文档 流量图 配额申请 | |
| Javascript API |
无请求数限制
|
查看文档 | ||
| Place API v2 |
请求数: 0% |
总请求数: 0.2万次/天
|
查看文档 流量图 配额申请 | |
| Geocoding API v2 |
请求数: 0% |
总请求数: 0.6万次/天
|
查看文档 流量图 配额申请 | |
| IP定位API |
请求数: 0% |
总请求数: 100万次/天
|
查看文档 流量图 配额申请 | |
| 路线交通API |
请求数: 0% |
总请求数: 0.2万次/天
|
查看文档 流量图 配额申请 | |
| Android导航离线SDK |
无请求数限制
|
|||
| IOS导航离线SDK |
无请求数限制
|
|||
| Android导航SDK |
无请求数限制
|
查看文档 | ||
| IOS导航SDK |
无请求数限制
|
|||
| 静态图API |
请求数: 0% |
总请求数: 100万次/天
|
查看文档 流量图 配额申请 | |
| 全景静态图API |
请求数: 0% |
总请求数: 10万次/天
|
查看文档 | |
| 坐标转换API |
请求数: 0% |
总请求数: 10万次/天
|
查看文档 流量图 配额申请 | |
| 鹰眼API |
请求数: 0% |
总请求数: 10万次/天
|
查看文档 流量图 配额申请 | |
| 到达圈 |
请求数: 0% |
总请求数: 0.01万次/天
|
||
| Android导航 HUD SDK |
无请求数限制
|
|||
| IOS导航 HUD SDK |
无请求数限制
|
|||
| 云逆地理编码API |
请求数: 0% |
总请求数: 0.2万次/天
|
流量图 配额申请 | |
| Routematrix API |
请求数: 0% |
总请求数: 0.2万次/天
|
流量图 配额申请 | |
| 云地理编码API |
请求数: 0% |
总请求数: 0.2万次/天
|
||
| 高精度IP定位 |
请求数: 0% |
总请求数: 0.1万次/天
|
流量图 配额申请 | |
| 时区服务 API |
请求数: 0% |
总请求数: 0.2万次/天
|
2.开发手册、demo
百度地图开放平台js开发demo
对于一种想要展示一系列展示固定点的需求,可以使用“麻点图层”的方法
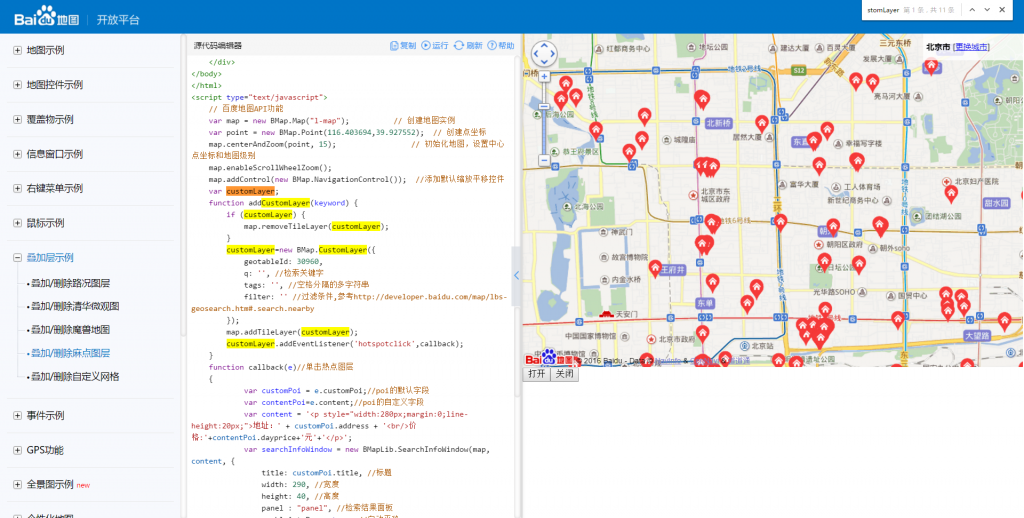
demo调试界面
3.坐标信息管理
注意到 “geotableId”:
   var customLayer;
    function addCustomLayer(keyword) {
        if (customLayer) {
            map.removeTileLayer(customLayer);
        }
        customLayer=new BMap.CustomLayer({
            geotableId: 30960,
            q: '', //检索关键字
            tags: '', //空格分隔的多字符串
            filter: '' //过滤条件,参考http://developer.baidu.com/map/lbs-geosearch.htm#.search.nearby
        });
麻点图层的原理,是使用百度云存储api(LBS云),送入自己点坐标信息的数据。再通过调用CutsomLayer在地图表层绘制麻点。
在百度云存储api的数据管理页面,可以通过可视化锚点,或者上传规范格式的csv快速添加数据(当然也可以通过get put直接上传,如果没有需求,当然可以只通过上传csv添加数据)
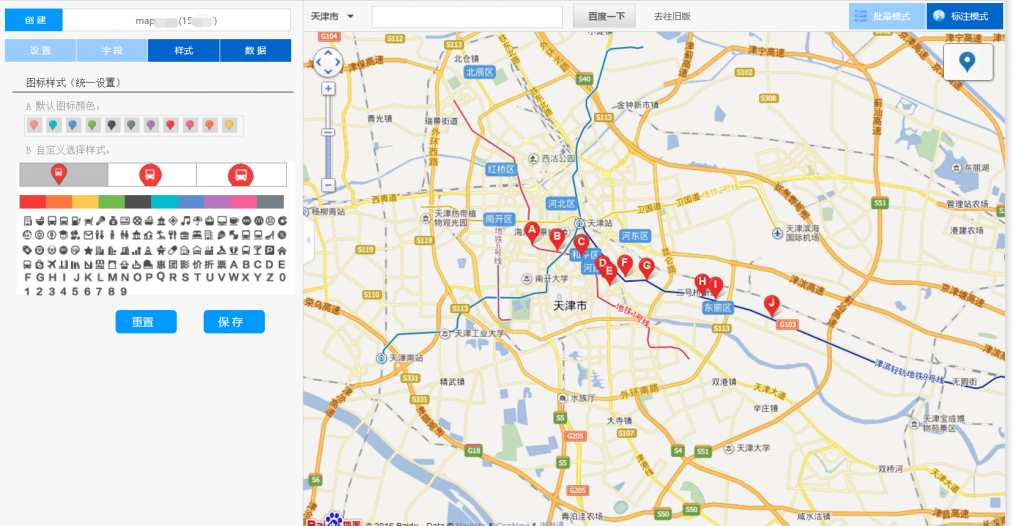
数据管理可视化界面
新建一个数据表,括号内即为geotableId。
csv可以直接下载示例,然后用excel可视化编辑。注意文档中给出的表值定义,不要填错
上传后可导入位置信息
4.api使用
官方给出的示例如下
http://developer.baidu.com/map/jsdemo.htm#g0_4
<!DOCTYPE html>
<html>
<head>
    <meta http-equiv="Content-Type" content="text/html; charset=utf-8" />
    <meta name="viewport" content="initial-scale=1.0, user-scalable=no" />
    <style type="text/css">
        body, html{
            width: 100%;
            height: 100%;
            margin:0;
            font-family:"微软雅黑";
            font-size:14px;
        }
        #l-map {
            width:100%;
            height:500px;
            overflow: hidden;
        }
        #result{
            width:100%;
        }
        li{
            line-height:28px;
        }
        .cityList{
            height: 320px;
            width:372px;
            overflow-y:auto;
        }
        .sel_container{
            z-index:9999;
            font-size:12px;
            position:absolute;
            right:0px;
            top:0px;
            width:140px;
            background:rgba(255,255,255,0.8);
            height:30px;
            line-height:30px;
            padding:5px;
        }
        .map_popup {
            position: absolute;
            z-index: 200000;
            width: 382px;
            height: 344px;
            right:0px;
            top:40px;
        }
        .map_popup .popup_main {
            background:#fff;
            border: 1px solid #8BA4D8;
            height: 100%;
            overflow: hidden;
            position: absolute;
            width: 100%;
            z-index: 2;
        }
        .map_popup .title {
            background: url("http://map.baidu.com/img/popup_title.gif") repeat scroll 0 0 transparent;
            color: #6688CC;
            font-weight: bold;
            height: 24px;
            line-height: 25px;
            padding-left: 7px;
        }
        .map_popup button {
            background: url("http://map.baidu.com/img/popup_close.gif") no-repeat scroll 0 0 transparent;
            cursor: pointer;
            height: 12px;
            position: absolute;
            right: 4px;
            top: 6px;
            width: 12px;
        }
    </style>
    <script type="text/javascript" src="http://api.map.baidu.com/api?v=2.0&ak=A4749739227af1618f7b0d1b588c0e85"></script>
    <!-- 加载百度地图样式信息窗口 -->
    <script type="text/javascript" src="http://api.map.baidu.com/library/SearchInfoWindow/1.5/src/SearchInfoWindow_min.js"></script>
    <link rel="stylesheet" href="http://api.map.baidu.com/library/SearchInfoWindow/1.5/src/SearchInfoWindow_min.css" />
    <!-- 加载城市列表 -->
    <script type="text/javascript" src="http://api.map.baidu.com/library/CityList/1.2/src/CityList_min.js"></script>
    <title>叠加麻点图层</title>
</head>
<body>
    <div id="l-map"></div>
    <div id="result">
        <button id="open">打开</button><button id="close">关闭</button>
    </div>
    <!--城市列表-->
    <div class="sel_container"><strong id="curCity">北京市</strong> [<a id="curCityText" href="javascript:void(0)">更换城市</a>]</div>
    <div class="map_popup" id="cityList" style="display:none;">
        <div class="popup_main">
            <div class="title">城市列表</div>
            <div class="cityList" id="citylist_container"></div>
            <button id="popup_close"></button>
        </div>
    </div>
</body>
</html>
<script type="text/javascript">
    // 百度地图API功能
    var map = new BMap.Map("l-map");          // 创建地图实例
    var point = new BMap.Point(116.403694,39.927552);  // 创建点坐标
    map.centerAndZoom(point, 15);                 // 初始化地图,设置中心点坐标和地图级别
    map.enableScrollWheelZoom();
    map.addControl(new BMap.NavigationControl());  //添加默认缩放平移控件
    var customLayer;
    function addCustomLayer(keyword) {
        if (customLayer) {
            map.removeTileLayer(customLayer);
        }
        customLayer=new BMap.CustomLayer({
            geotableId: 30960,
            q: '', //检索关键字
            tags: '', //空格分隔的多字符串
            filter: '' //过滤条件,参考http://developer.baidu.com/map/lbs-geosearch.htm#.search.nearby
        });
        map.addTileLayer(customLayer);
        customLayer.addEventListener('hotspotclick',callback);
    }
    function callback(e)//单击热点图层
    {
            var customPoi = e.customPoi;//poi的默认字段
            var contentPoi=e.content;//poi的自定义字段
            var content = '<p style="width:280px;margin:0;line-height:20px;">地址:' + customPoi.address + '<br/>价格:'+contentPoi.dayprice+'元'+'</p>';
            var searchInfoWindow = new BMapLib.SearchInfoWindow(map, content, {
                title: customPoi.title, //标题
                width: 290, //宽度
                height: 40, //高度
                panel : "panel", //检索结果面板
                enableAutoPan : true, //自动平移
                enableSendToPhone: true, //是否显示发送到手机按钮
                searchTypes :[
                    BMAPLIB_TAB_SEARCH,   //周边检索
                    BMAPLIB_TAB_TO_HERE,  //到这里去
                    BMAPLIB_TAB_FROM_HERE //从这里出发
                ]
            });
            var point = new BMap.Point(customPoi.point.lng, customPoi.point.lat);
            searchInfoWindow.open(point);
    }
    document.getElementById("open").onclick = function(){
        addCustomLayer();
    };
    document.getElementById("open").click();
    document.getElementById("close").onclick = function(){
        if (customLayer) {
            map.removeTileLayer(customLayer);
        }
    };
    // 创建CityList对象,并放在citylist_container节点内
    var myCl = new BMapLib.CityList({container : "citylist_container", map : map});

    // 给城市点击时,添加相关操作
    myCl.addEventListener("cityclick", function(e) {
        // 修改当前城市显示
        document.getElementById("curCity").innerHTML = e.name;

        // 点击后隐藏城市列表
        document.getElementById("cityList").style.display = "none";
    });
    // 给“更换城市”链接添加点击操作
    document.getElementById("curCityText").onclick = function() {
        var cl = document.getElementById("cityList");
        if (cl.style.display == "none") {
            cl.style.display = "";
        } else {
            cl.style.display = "none";
        }
    };
    // 给城市列表上的关闭按钮添加点击操作
    document.getElementById("popup_close").onclick = function() {
        var cl = document.getElementById("cityList");
        if (cl.style.display == "none") {
            cl.style.display = "";
        } else {
            cl.style.display = "none";
        }
    };
</script>
需要修改:
<script type="text/javascript" src="http://api.map.baidu.com/api?v=2.0&ak=A4749739227af1618f7b0d1b588c0e85"></script>//更换自己的秘钥
var point = new BMap.Point(116.403694,39.927552); // 修改成你的初始点坐标
geotableId: 30960, // 数据表的id
最后将代保存成html文件,本地打开或者上传到网页空间,能获得自己创建的麻点图,实现快速静态位置信息可视化。
5.后记
还是那句,在一些队伍内展示的场合,或者只是团队内构建道路信息的工具,就可以用在线地图api实现可视化。开发产品当然另当别论,需要深入研究前端,实现交互、实时更新等等。


[…] 2016-10-29 用百度地图api快速实现经纬度地理位置可视化 […]